
Power Quality Analysis
Power Quality Analysis in a tyre conglomerate revealed the root cause of repetitive electronic card failures in SCADA, HMI, Hard Disk and AC/DC Drives and frequent unwanted tripping in its process due to voltage fluctuation. The supervisory control and data acquisition system, which is a combination of software and PLC/Computer hardware, malfunctions in sending correct batch data from HMI to process computer missing out a few process data, each day. The LED fitting driver fails due to triplen harmonics which in-addition cause a neutral current in the lighting transformer feeder.
The Curing section is most sensitive in the tyre manufacturing process which used to trip frequently on voltage fluctuation. During monsoon, there used to be persistent tripping with chronic grid voltage surges. The plant management planned to upgrade the 33kV grid incomer to 132kV for solving the tripping problem. It was very costly, and that could not have solved the tripping problem anyway.
The introduction of steel radial tyres brought in considerable non-linear loads (NLL) in the forms of variable speed drive (VSD), DC drives and sizeable SCADA and HMI controls in the tire manufacturing process. Premier tyre companies complying with safety regulations upgraded their process for high quality and long life radials, which further increased PLC and HMI control. It resulted in an increased total current harmonic distortion (THDi) which at the base level, without switching on capacitors, was between 20 to 40% at the main incomer of various process transformers with a corresponding total voltage harmonic distortion (THDv) of between 5 to 10%.
Factory engineers need to maintain Power Factor (PF) for avoiding high demand (kVAh) charges and low PF penalty from the utility company. But they faced a new problem in adding capacitors either at load end across various high capacity motors or at PCC loads or centralized APFC panel across transformer LT busbar. It magnified harmonics in an unpredictable and non-linear manner. The magnification could be as high as several times the base harmonic level or just a few percentage point higher, which depends upon the fault level of the power system. In a high fault level power system, THDi magnifies disproportionately higher than THDv. The reverse happens with a low fault level power system.
Then arrived the Detuned Harmonic Filter with a 6% reactor in series with the capacitor. Though it solved the harmonic magnification problem and improved the PF, it could not solve the repetitive equipment failure and nuisance tripping problem, and the detuned filter itself failed frequently needing continuous component replacement. Besides, it can not reduce harmonics. When the real solution arrives, the detuned filter needs to be replaced, paving the space for the super tuned harmonic filter that solves all the failure and tripping issues besides slashing down harmonics, both THDi and THDv, within IEEE 519 limits.
How did the high harmonics bring in Power Quality Problem and unwanted equipment tripping in the tire industry? Well, that issue explained in details in another webpage "Power Quality Solution Delivered". What did it take to resolve both the trouble, equipment failure and nuisance tripping? The approach to the solution, its methodology and efficacy described exhaustively on another webpage "Passive Harmonic Filter proven valuable When Equipment Fails".
Power Quality Analysis Report
The following Power Quality Analysis Report was published in the APQI EU-Asia power quality initiative journal in 2009. Even though a summary report, it contained all major building blocks of a comprehensive power quality analysis service. A synopsis data table highlights the power and harmonic level at all feeders in the factory, major equipment groupings, power quality measurement graphs and recommendations for problem-solving. The detailed report contained Power Quality Signature Analysis for root cause analysis for troubleshooting some elusive failures. This study model repeated through the succeeding decades across all plant locations on a PAN India basis, study recommendations implemented, projected results achieved and consistently, benefits derived.
Abstract: Large continuous process plants are increasingly resorting to use of non linear loads (NLL) such as DC drives, variable speed AC drives, UPS, increased electronic controls etc. to improve performance and productivity of their plants. The plant engineers are increasingly facing unfamiliar problems related to power quality (PQ) mainly problem of distortion of fundamental wave shape and associated effects.
Harmonics are as old a phenomenon as the introduction of AC System. Mercury arc rectifiers (MAR) developed in 1920's and semiconductor controlled rectifiers (SCR) or thyristors developed in 1950's created harmonics, due to their nature of non-linear loads. However, use of non-linear load was less then (typically less than 5% in 1960), to have any significant impact. But it is now increasing rapidly thus making Power Quality a great concern among plant engineers and associated equipment manufacturers.
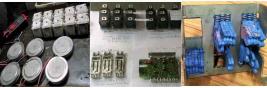
Magnified harmonics cause severe stress on the plant & machineries. Electronics are the first to fail being weakest among all, followed by fuse, capacitors, thyristor, CT, Motor etc.
This power quality analysis report represents summary of findings and recommendations of comprehensive analysis & data emerging out from Power Quality audit of a tyre manufacturing factory.
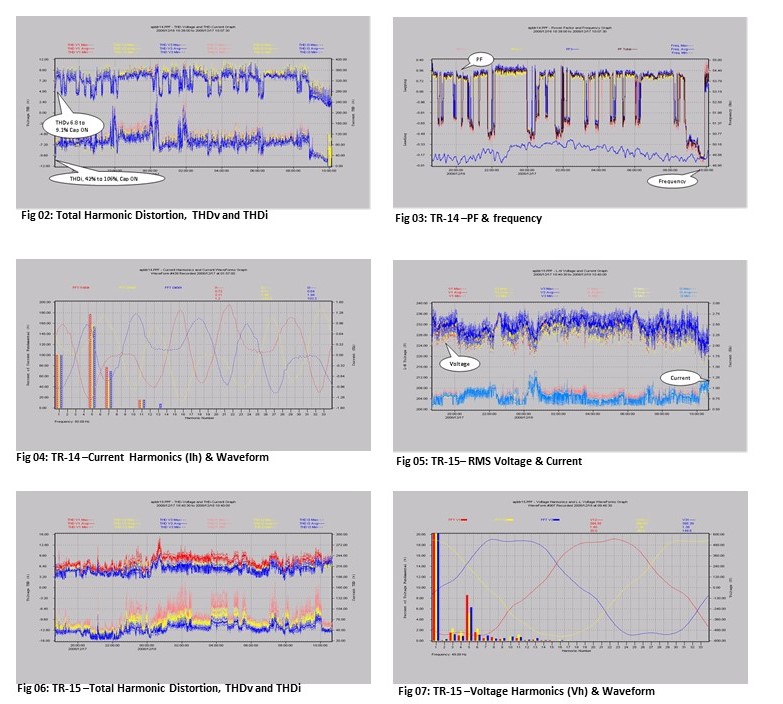
The study revealed that most of the feeders had very high level of THD. Following are just example for 2 feeders from the study-Transformers TR-14 & TR-15 with major NLL and Capacitors ON/OFF.
Capacitors ON/OFF: Table 01 Example for high harmonics level at 2 feeders
Load with Major NLL Without Capacitor With Capacitor REMARKS
THD-v THD-i THD-v THD-i
TR -14, 2.5MVA, 11/0.400kV 6.8% 42% 9.1% 106% 450kVAr at Panel -OFF/ ON
TR -15, 2.5MVA, 11/0.400kV 8.3% 77% 9.2% 126% 400kVAr at Panel -OFF/ ON
As THD-I and THD-v are much higher than IEEE norms, the study recommended installing tuned harmonic filters at 400V secondary side for TR -14 and 15 (in Phase -I) to limit harmonic distortion of both THD-v & THD-i within regulatory norms, save energy substantially (typically 5%) and eliminate failure/nuisance tripping. It should help in enhancing product quality and overall profitability. Similarly, 2 sets of filters for 'Banbury' mixers and one filter for 450 kW squirrel cage induction motor feeder were recommended to resolve issues of high harmonics, abnormal behaviour during starting of motors through soft starter such as starting current as high as 9 times full load current, voltage dip of 23% and so on. The total cost of recommendation for phase I was INR 59,50,000 with an attractive simple pay back period of 10 months.
In Phase -II, it was recommended to install tuned harmonic filters in 7 more transformers where it was observed that the level of harmonics were high.
Industry Background:
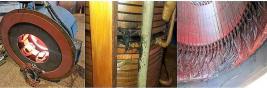
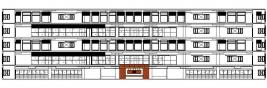
Processing & Production: The tyre making process starts by mixing different varieties of rubber with process oils, carbon black, pigments, antioxidants, accelerators and other additives, each of which contributes certain properties to the compound. These ingredients are mixed in giant blenders (called banbury mixers) under tremendous heat and pressure. The ingredients are blended together into a hot, black gummy compound that will be milled. The cooled rubber takes several forms. Most often it is processed into carefully identified slabs that will be transported to breakdown mills. These mills feed the rubber between massive pairs of rollers, repeatedly feeding, mixing and blending to prepare the different compounds for the feed mills, where they are slit into strips and carried by conveyor belts to become sidewalls, treads or other parts of the tyre.
Indian Tyre Industry (Source: Report on Indian Tyre Industry): The Indian Tyre Industry produced 736 lakh units of tyres (11 lakh tonnes) garnering Rs. 19,000 crores in FY 07. MRF Ltd. was the market leader (22% market share) followed closely by Apollo Tyres Ltd. (21%). The other major players were JK Tyre & Industries Ltd (18%) and Ceat Ltd. (13%). The industry tonnage production registered a 5 year CAGR of 9.69% between FY 02-07.
Truck & Bus tyre category (accounting for 57% of the tonnage production) recorded a 5 year CAGR of 7.85% (a rate slower than that of the industry) while Light Commercial Vehicle (LCV), Motorcycle and Car tyre categories grew at 15%, 16% and 14% respectively (at rates faster than that of the industry).Off the road (OTR) tyres (customized tyres which fetch a higher margin compared to other tyres) category is growing at a fast pace. The OTR tyre category registered a 5 year CAGR of over 20% in the last five years.
The exports from the country clocked a CAGR of 13% in unit terms and 18% in value terms in the period FY 0207. Most of these tyres that are exported are of cross ply design.
With radialisation catching up in some of these markets, the manufacturers will need to graduate to radial tyres so as to protect their share in the export market. Radialisation of tyres is still minimal in India. Only the car tyre market has moved to radial tyres (95%) but in all other categories cross ply tyres are still preferred. Poor road conditions, overloading in trucks, higher initial cost of radial tyres and poor awareness levels in tyre users are the main reasons for the non transition of the domestic market to radial tyres.
However, going ahead, radialisation in truck & bus tyres may increase due to government's focus on infrastructure development. Research expects the tyre industry to register a tonnage growth of 910% in the next five years (FY 0712).
The truck & bus and LCV tyre category are expected to register a CAGR of 8% and 14% respectively (FY 0712). As per the annual report for the year 2007-2008 of a leading company, the energy Consumption was 671.57 KWH/MT in 2007-08.
System details
Power Source
1. GEB TR I/C -1, 10MVA, 66/11kV
2. GEB TR I/C -1, 10MVA, 66/11kV
3. DG-1, 4.0MW, 11kV
4. DG-2, 4.0MW, 11kV
5. GT-1, 5.0MW, 11kV
Banbury Mixtures -General Details - Cycle time & Energy Intensity: The plant have old DC Drive system for BNB-1 to 4 installed during 90's and new ABB VFD system for BNB-105 & 106 installed during recent times. Their power consumption depends upon product mix and cycle time. BNB-1 has shortest 1.7 minute cycle time for final mix and have highest power consumption. BNB-2 to 4 has longest 3.3 minute cycle for master mix & consumes least power. BNB-105 (master mix) and BNB-106 (final mix) have 2.3 minute cycle time & have its own pattern of power consumptions.
Consumption Details - Energy pie - Table 02 Energy consumption details
Plant Details kW-ave. Process Banbury Utility Remarks
Banbury & Aux
BNB-1, BIAS 650 650
BNB-2, BIAS 150 150
BNB-3, BIAS 110 110
BNB-4, BIAS 120 120
BNB-5, PCR 340 340
BNB-6, PCR 240 240
TR-3, BNB-1+2 Aux 1104 1104
TR-11, BNB-3+4 Aux 603 603
TR-16, BNB-5+6 Aux 590 413 177
Process
TR-4, BIAS 860 860
TR-5, BIAS 746 746
TR-6, BIAS 657 657
TR-7, BIAS 317 317
TR-13, BIAS+30%PCR 710 710
TR-14, PCR 270 270
TR-15, PCR 440 440
Utility
TR-8, Utility 1114 1114
TR-9, Utility 673 673
TR-18, PCR+Project 330 198 132
TR-19, PCR+Utility 910 637 273
TR-20, PCR 250
Total Energy (Ave.) 10934 5085 3730 2369
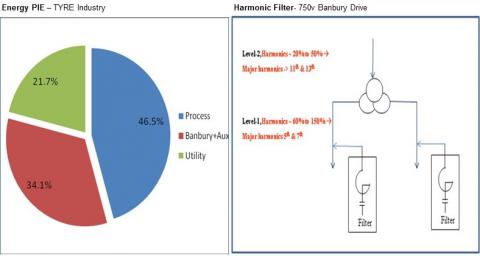
%-Consumption 46.5% 34.1% 21.7%
Energy Pie Chart -Based on 24hrs average running, total plant load was 10934kW-average, comprising of Banbury & it auxiliary, Process and Utility section for both BIAS and PCR tyres. This pie chart (as in the caption picture above) is based on the running condition that prevailed during the audit.
Objective
" To identify power quality & harmonics distortion present in the power system and assess the reasons for frequent failure of electronic components, capacitors, overheating/spurious tripping of switchgear due to large usage of non-linear loads (NLL) like DC drives, VFD, UPS etc.
" To recommend suitable correction measures for the issues of PQ after analysis.
Methodology: A detailed power quality analysis services consisting of various power quality measurement was planned. Study analysis included taking various electrical related measurements using sophisticated data logger as per the requirements of relevant national & International standards namely IEEE. Refer Annexure - 1 for harmonic distortion limits as per IEEE-519,1992. Measurements were taken of relevant parameters, which are listed in following tables and diagrams/graphs.
Process: A detailed Power Quality Audit involving measurements of various parameters at different locations of the plant was undertaken.
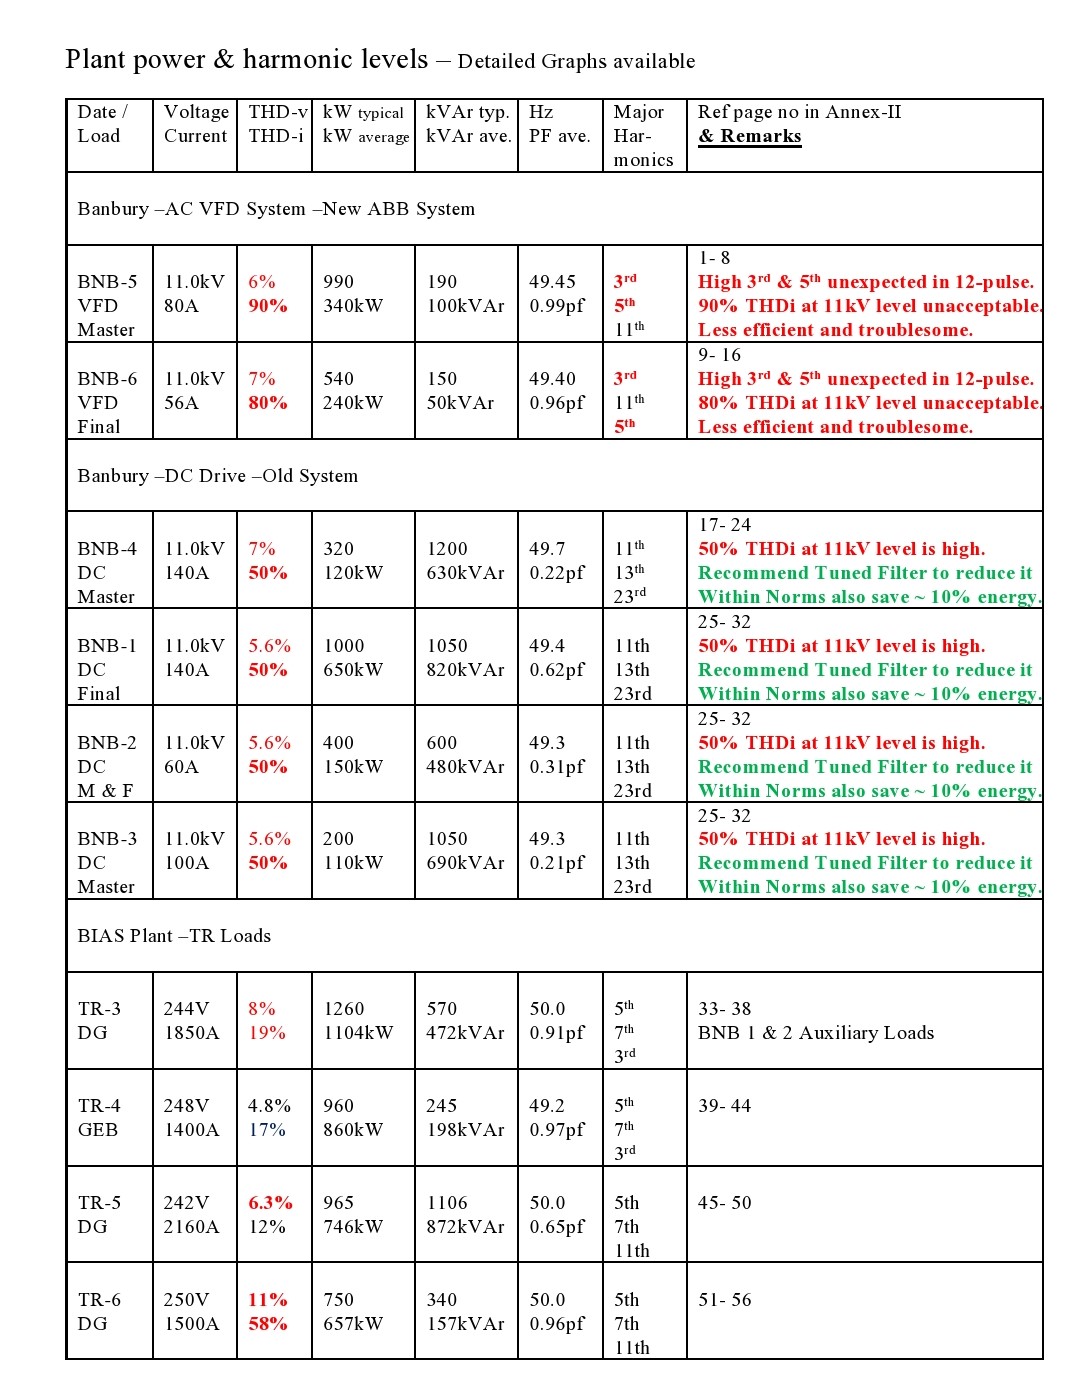
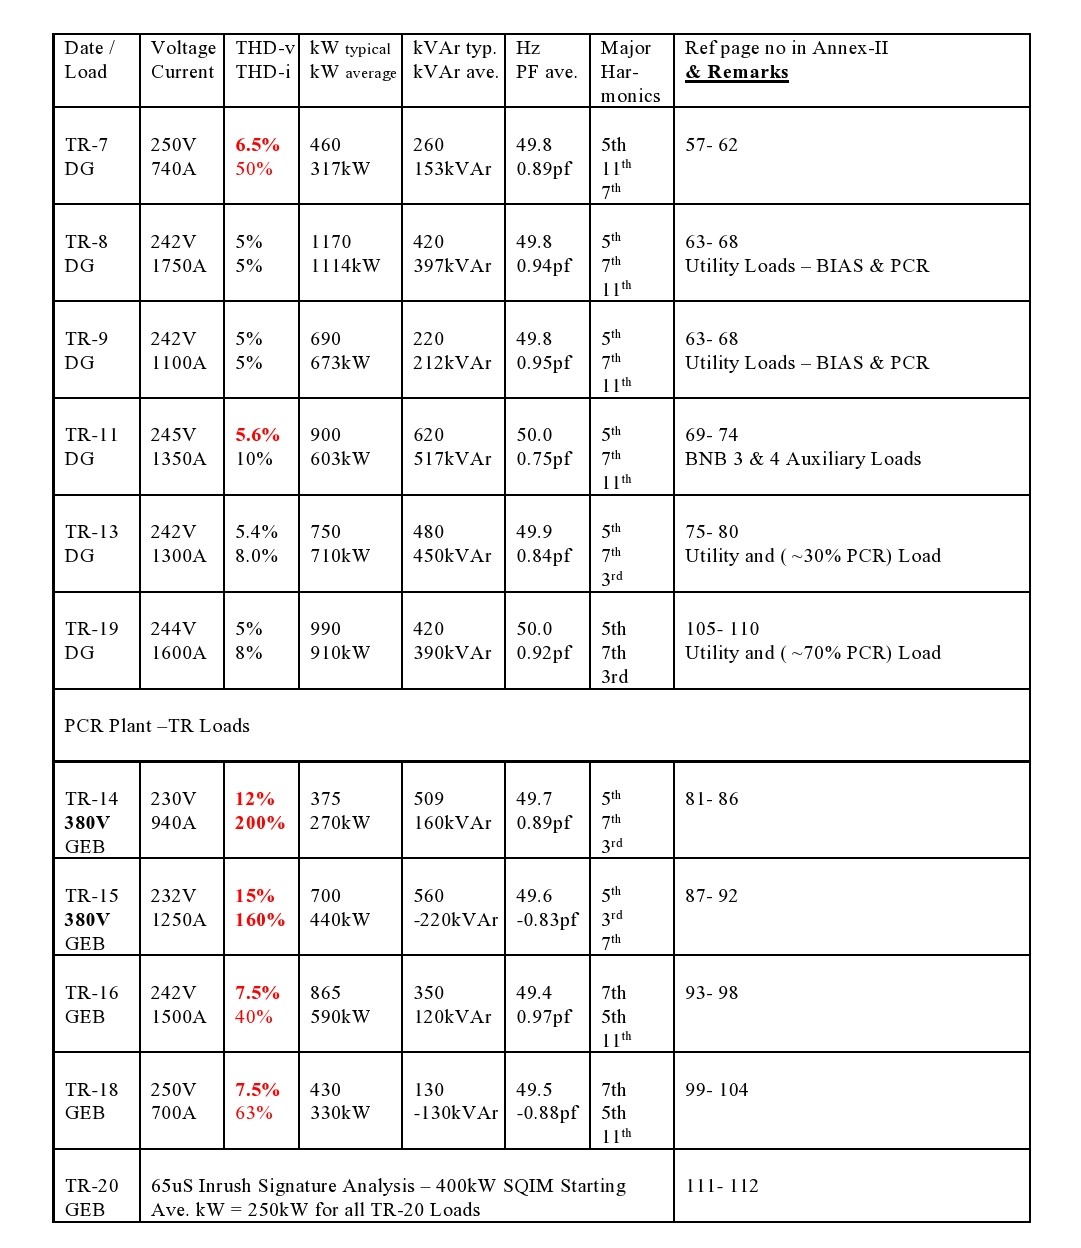
PQ study OBSERVATIONS and ANALYSIS: Measurements-plant power & harmonic levels are given in the table below:
----------------------------------- Page-1 of 2----------------------------------------
----------------------------------- Page-2 of 2----------------------------------------
Observations & Recommendations
Harmonics Distortions & Power Quality (PQ) Issues
Capacitors - the cause of harmonic magnification
To improve efficiency of low PF systems, the simplest solution is to add capacitors to correct inductive load. However, such approach creates serious operation problem if high level of harmonics are present in the system.
Any combination of capacitance and inductance forms a circuit, which is tuned to what is called as "resonance frequency". It is the frequency at which both capacitive & inductive reactance equals.
If significant harmonic energy is present due to usage of nonlinear load (NLL) like dc drives, vfd, ups etc. and its frequency matches with that of the resonant circuit formed by the PF correcting capacitor and system inductance, it will excite the current into oscillation. A very large amount of harmonic current will flow magnifying harmonic voltage. Its effect can blow fuses, damage components and reflect in excessively high harmonic level into the entire facility. In addition, since the high oscillation current in the resonant circuit is wasted and no useful work is done, it will drop pf.
Following are just example for TR-14 & TR-15 with major NLL and Capacitors ON. With such magnified harmonics it causes severe stress on plant & machineries. Electronics are the first to fail being weakest among all, followed by fuse, capacitors itself, Thyristor, CT, Motor etc.
Typical measurement graphs of TR-14 and TR-15 only are given below.
----------------------------------- Page-1 of 1----------------------------------------
Banbury -DC System - Harmonic Performance & Energy Efficiency
All measurement were taken at common 11kV factory's PCC Bus, thus all voltage and Voltage harmonic data should reflect to summation of plant's figure and not for individual BNB, which if required were measured at BNB working voltage level, which was 750V for DC system.
The voltage harmonic THD-v exceeded regulatory norm of 5% at 11kV bus, which reflected ambient harmonic conditions, which was harmful to plant & machineries. The recommended measures contained in this report should also help to bring down this ambient THD-v distortion.
The current harmonic THD-i exceeded regulatory norm and was in the order of max 50% at 11kV bus for all BNB - 1 to 4 drives with major 11th, 13th & 23rd harmonics. However THD-i at 750V side was expected to be few times its HT value with 5th & 7th as major harmonics. Such a system caused severe stress for sensitive drives & electronics and usually handled with de-rating which caused substantial energy loss and increased initial project cost.
Banbury -AC System - Harmonic Performance & Energy Efficiency
The voltage harmonic THD-v exceeded regulatory norm of 5% at 11kV bus, which reflected ambient harmonic conditions, which was harmful to plant & machineries.
The current harmonic THD-i exceeded regulatory norm and was in the order of max 80% & 90% at 11kV bus for BNB - 105 & 106 with major 3rd, 5th & 11th harmonics which were unexpected and highly undesirable. In-addition THD-i at 1.9kV side was expected to be few times its HT value. Such a system caused severe stress for sensitive drives & electronics and usually handled with de-rating which cause substantial energy loss and increase initial project cost. Looking into undesirable harmonic performance this AC system would be less efficient and troublesome. Its harmonic trend graph (long duration/ 12hrs & close-up view) indicated mostly 3rd and 5th & 7th.
TR-20 400kW Squirrel Cage Induction Motor (SQIM) - Performance during Starting with soft starter
Trouble-Shooting - 65uS Inrush Signature Analysis
All measurements were taken at common 660V outgoing feeder for 400kW SQIM Soft Starter. It was reported that squirrel case AL winding bar gave away during starting twice and after its strengthening with CU bar, stator winding was failing during starting.
Stating current for a motor depends upon the instant of voltage waveform during which the start takes place and loading on the motor. During audit we have taken totally 3-starts at different times with motor coupled condition, but without any load in the cracker mill drive.
Normal start behavior was with starting current about 5-times full load current of the motor, which is 365A and voltage dip about 11%. Abnormal start behavior was with starting current about 9-times full load current of the motor, which is 365A & voltage dip about 23%. In-addition THD-v shot-up to over 10%. Due to All such high fluctuations, compounding each other and motor was getting a magnetic run-away type of situation during starting causing oscillation for both voltage & current, due to which the motor had a history of failures.
PQ solution recommended
It was recommended to install tuned harmonic filters at 400V TR SEC side for TR -14 and 15 in Phase -I, to limit harmonic distortion both THD-v & THD-i within regulatory norms, save energy substantially (typically 5%) and eliminate failure/nuisance tripping.
In-addition harmonics were found to be high in the following TR, for which it was recommended to install tuned harmonic filters in Phase -II.
o All TR in PCR Plants -TR-16 and TR-18-totalling 2 Nos.
o BIAS Plant- TR-3, 5, 6, 7 & 11-totalling 5 Nos.
In Banbury - DC System, it was recommended to install tuned harmonic filters at 750V side that should limit harmonic distortion both THD-v & THD-i within regulatory norms, save energy (typically 10%) and eliminate failure/nuisance tripping.
In TR-20 400kW squirrel cage induction motor, in order to restrict all the 3-fluctuations in the soft starter, within some manageable level while starting, It was recommended to install a tuned L-C circuit that should work like an electrical fly-wheel opposing any change of voltage that in turn oppose rise of current. This will in turn minimise voltage spikes, thus helping starting current to remain stable.
Once the L-C tuned circuit was installed, motor should have fewer fluctuations from frequent starts that were required for this cracker mill application, helping to run it in cooler condition. Because of cooler run and fluctuation controls, it was expected on average should save 5% motor energy.
Table 04: Summary of Recommendations - Phase -I is given in the table below:
Summary of No. of Cost - Savings- Simple Payback
Recommendations Filters INR Lakhs INR Lakhs - In Months
Banbury -1 at 750V TR SEC
TR-1, 2.4mva, 11/0.750 -0.750kV 2-Sets 2x8.70=17.40 28.55 7-Months
400kW SQIM at 660V I/C of Soft Starter
TR-20, 1.25mva, 11/0.660kV 1-Set 6.70 5.10 16-Months
TR-14 & 15 at 380V TR SEC
TR 2.2mva, 11/0.380kV 2-Sets 2x17.70=35.40 40.02 11-Months
2x 17.70 =
Total cost and Payback Period 5-Sets 59. 50 73.67 10 -Months
Conclusion
The recommendations are under active consideration by the management of the tyre industry studied. The solutions are well within the acceptable levels as the benefits and simple pay back period indicate that they more than justified.
About the Author and the company
Author : Undeclared
Company : Reputed Global Tyre Manufacturing Company in India
Case Study 17. Year: 2009.
The sole responsibility for the content of this document lies with the authors. It does not represent the opinion of the European Communities. The European Commission is not responsible for any use that may be made of the information contained therein.
APQI is supported by Asia Invest Europe Aid Co-operation Office and Leonardo Energy.

----------------------------------- Page-1 of 1----------------------------------------